Subway Design Software for Transportation Engineers
Results
Proposed the design of a new subway layout software, leveraging data visualization techniques that
enables transportation engineers to gather insights of traffic flow and design effective layouts.
Objective
Create a Subway Layout Software that allows transportation engineers to design subway layouts that
connect high-traffic zones
in peak hours.
The Subway Layout Software should assists Transportation Engineers in completing their tasks. Given the
nature of the user group, I made the following assumptions:
Map and traffic datasets are available
User is proficient in understanding visualizations
Defining Scope
Based on the user's goal, I identified three main areas of focus - Traffic Analysis, Designing
Layout
and Impact Analysis.
The solution should enable users to visualize and analyze map and traffic data, gather
insights and create a subway layouts using design tools. The solution should allow
the
user understand impact
of new layout and make iterative changes. Leveraging AI, software can recommend layouts but for the
purposes of this project, this has been left out of the scope.
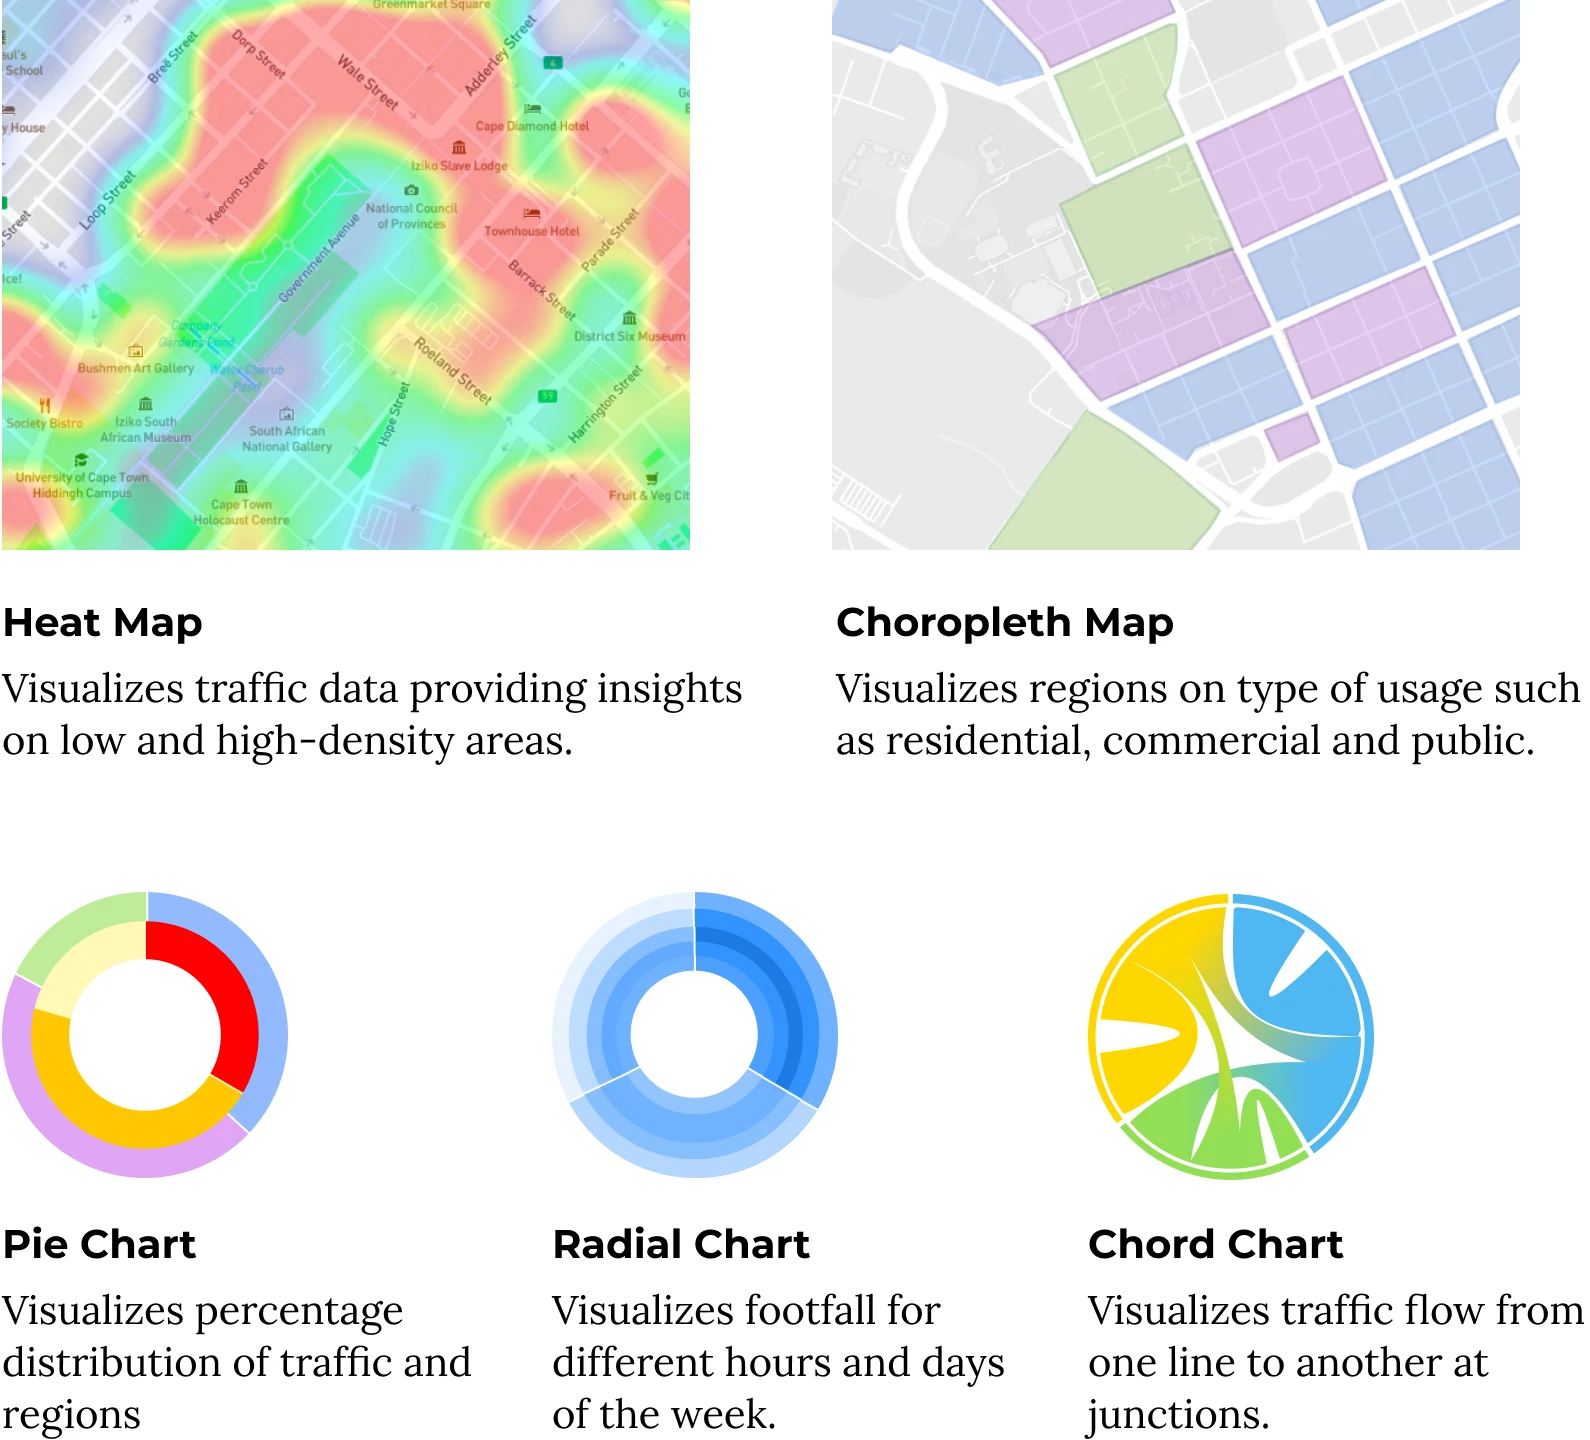
Research
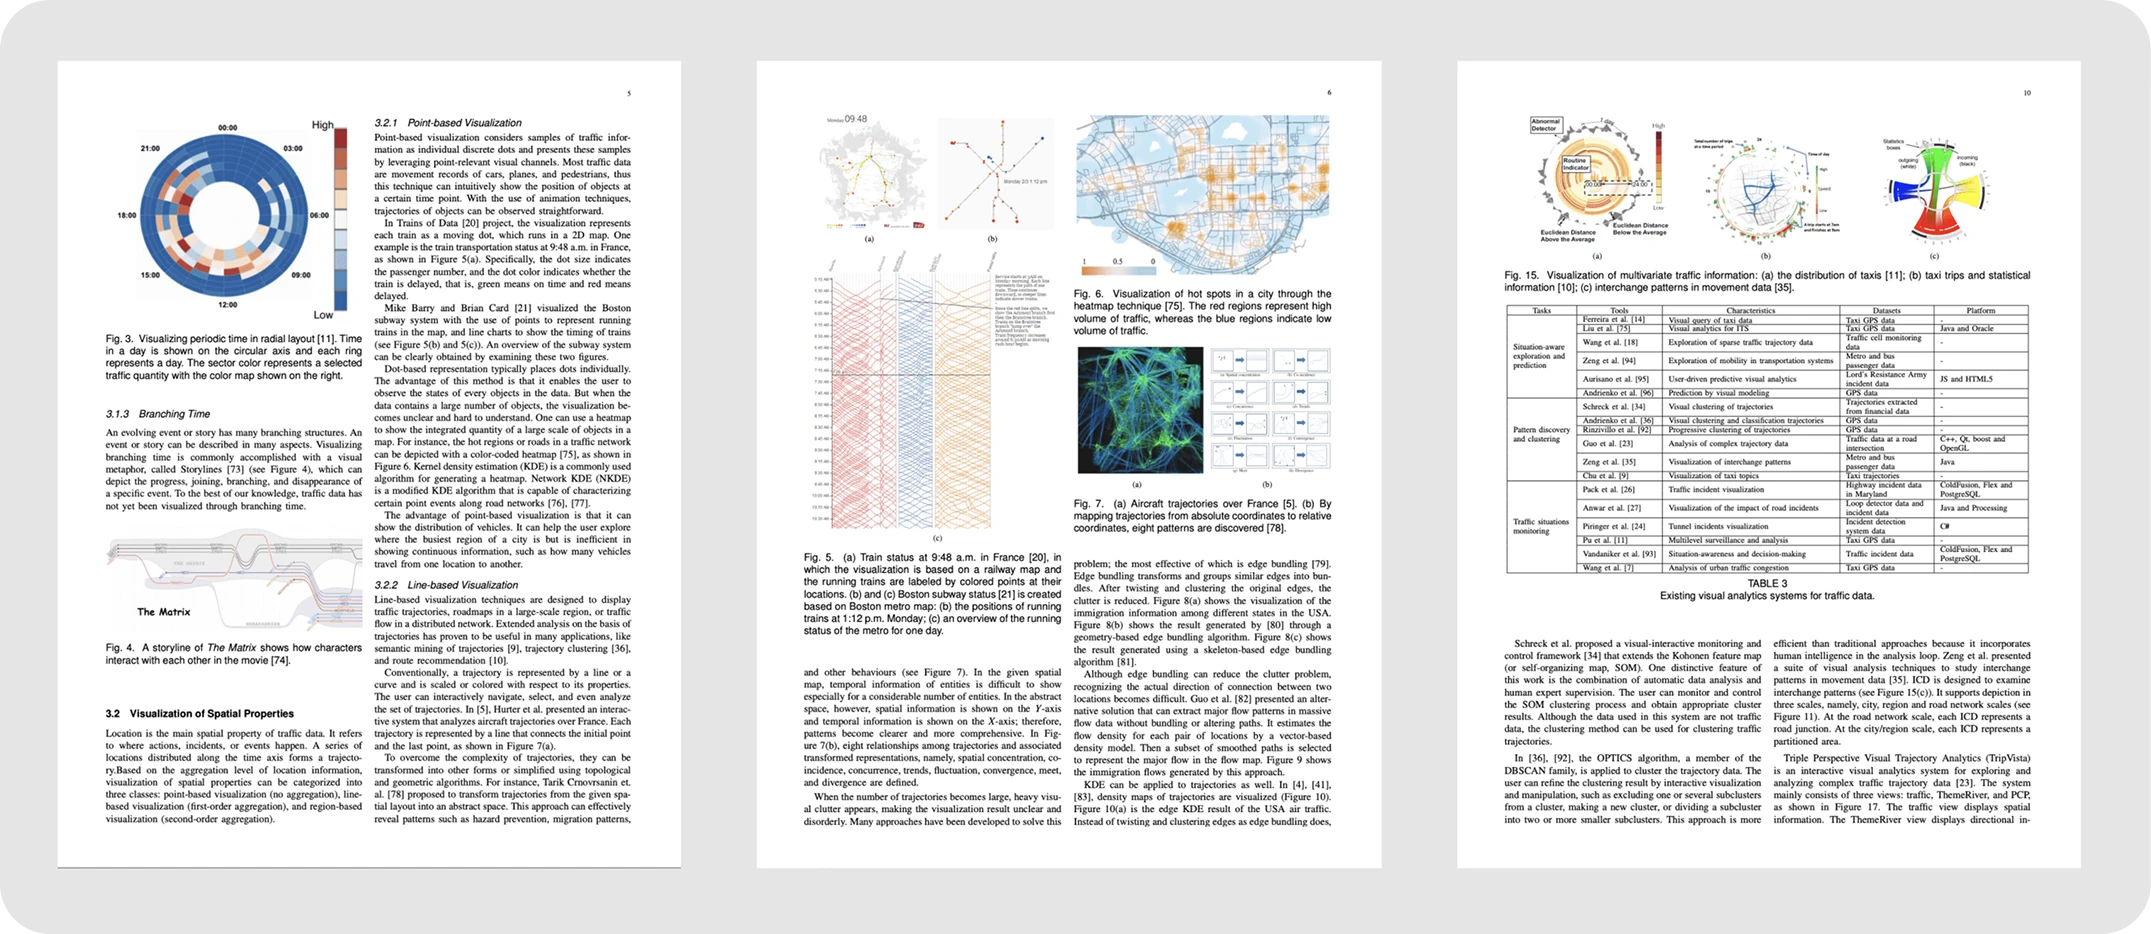
To assist transportation engineers analyze traffic data, the design should support visualization of
traffic. I conducted a secondary research on various data visualization techniques
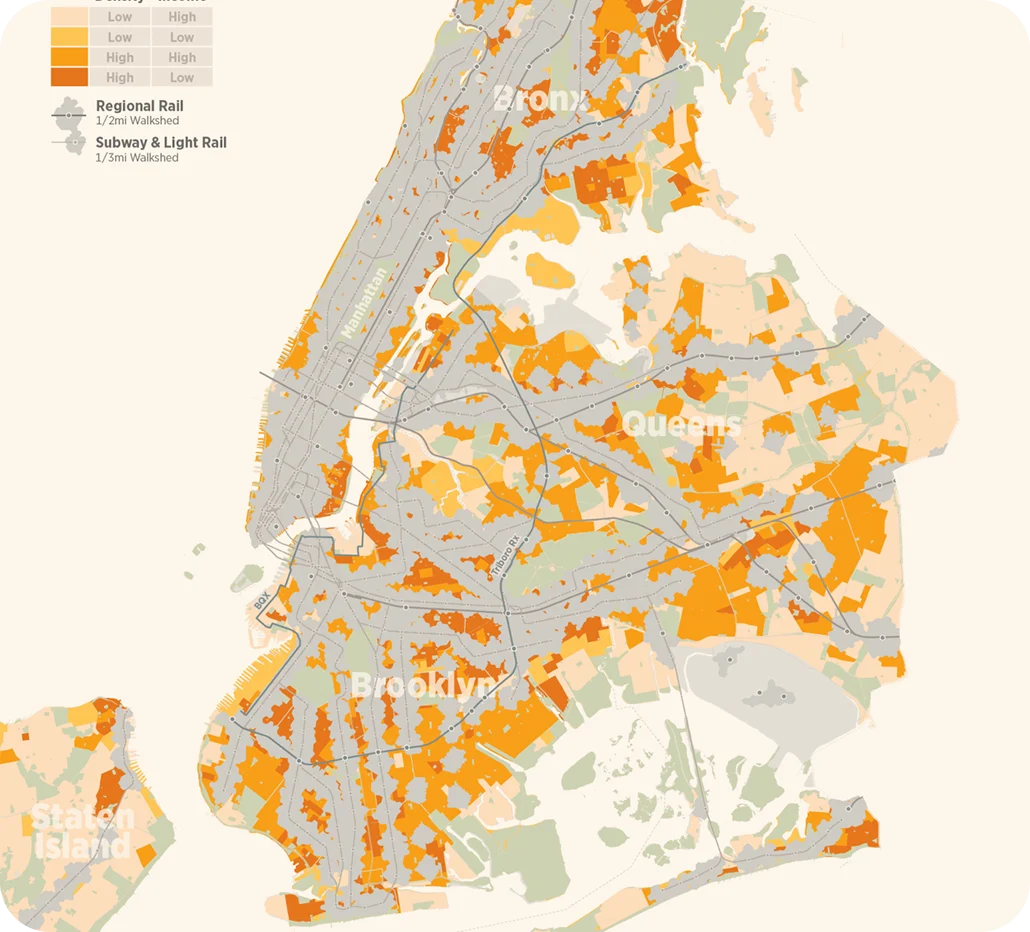
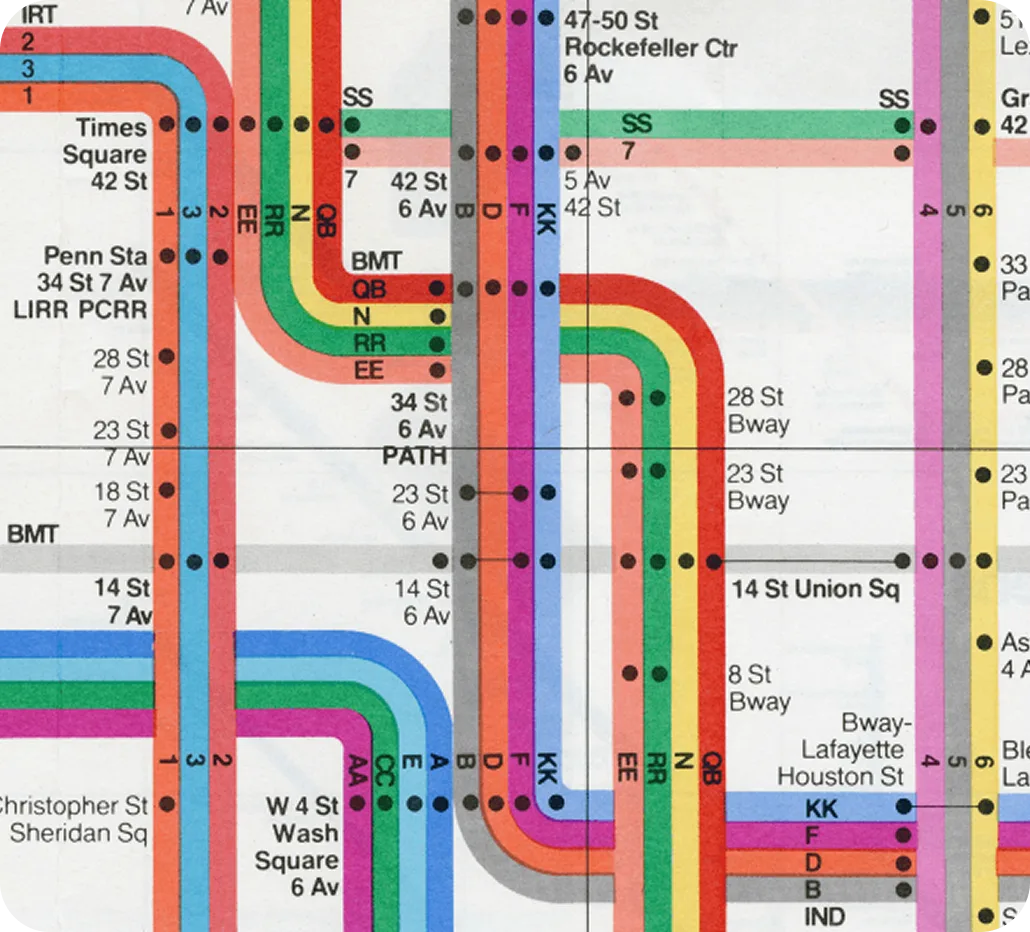
. I also conducted
desk research to understand existing problems in designing subway layouts and familiarized myself with
current-day layout designs.
This paper summarizes the existing visualization techniques to visualize high-traffic datasets
that contain multiple variables, of which time and space are most important.
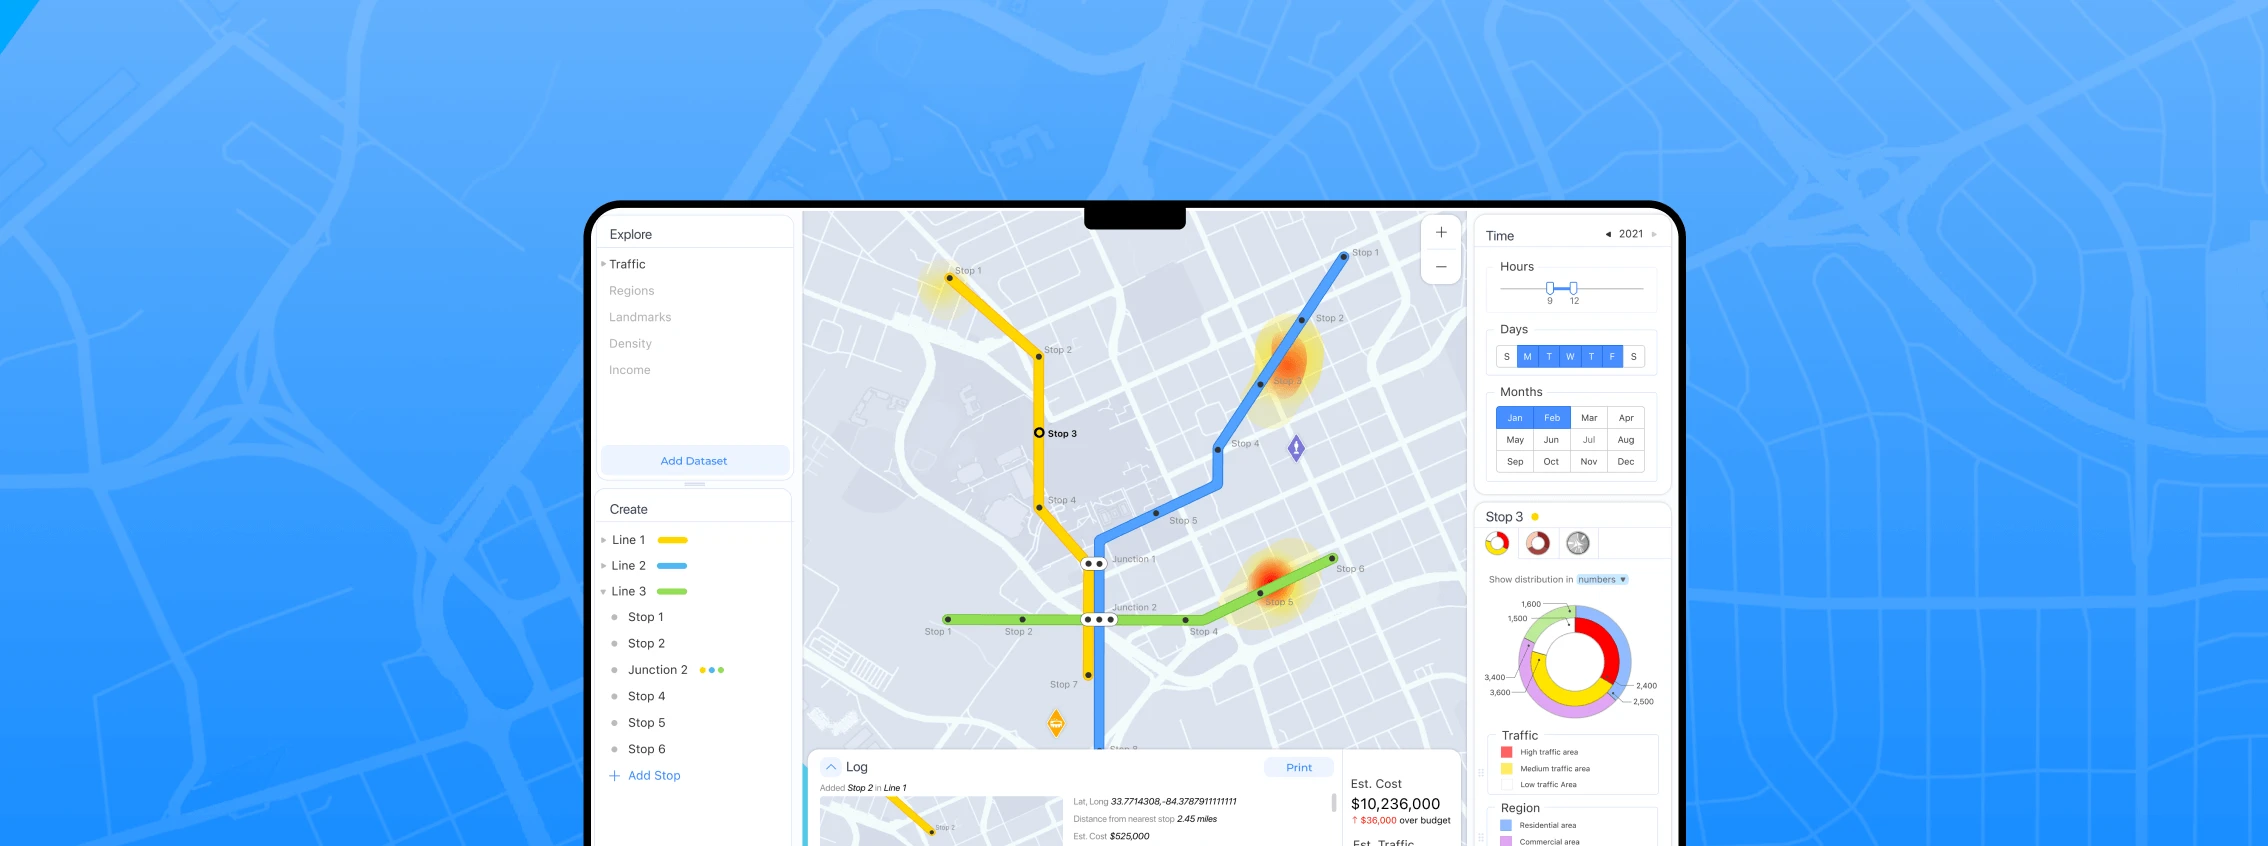
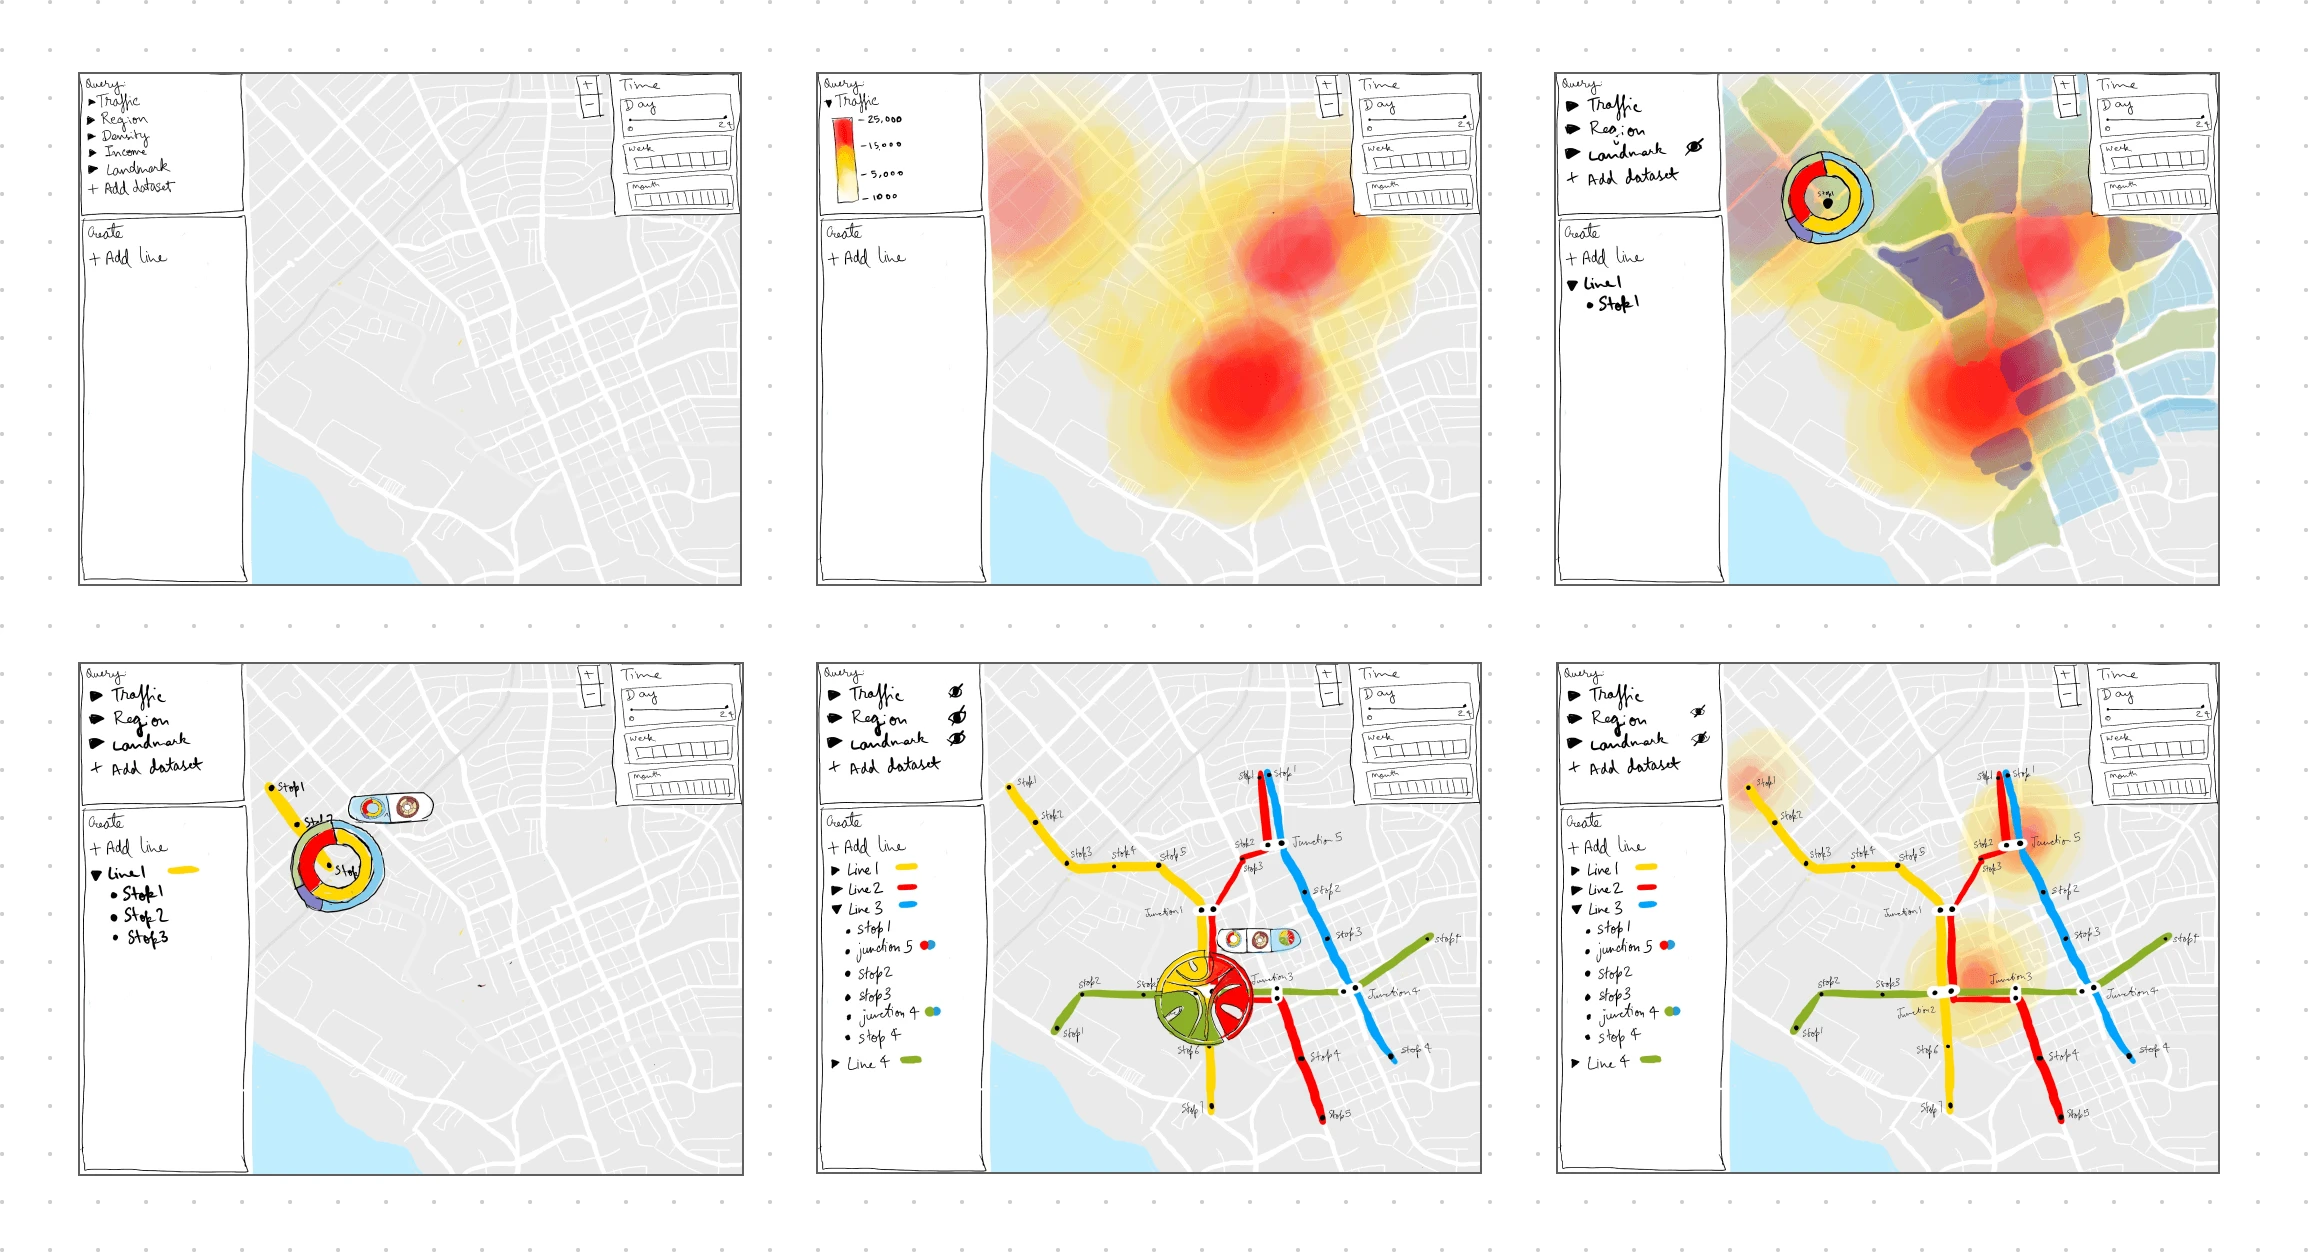
After adding a few more details and functionalities, I designed the below visual mockup to demonstrate
the design of the software application.
Highlight of Key Features
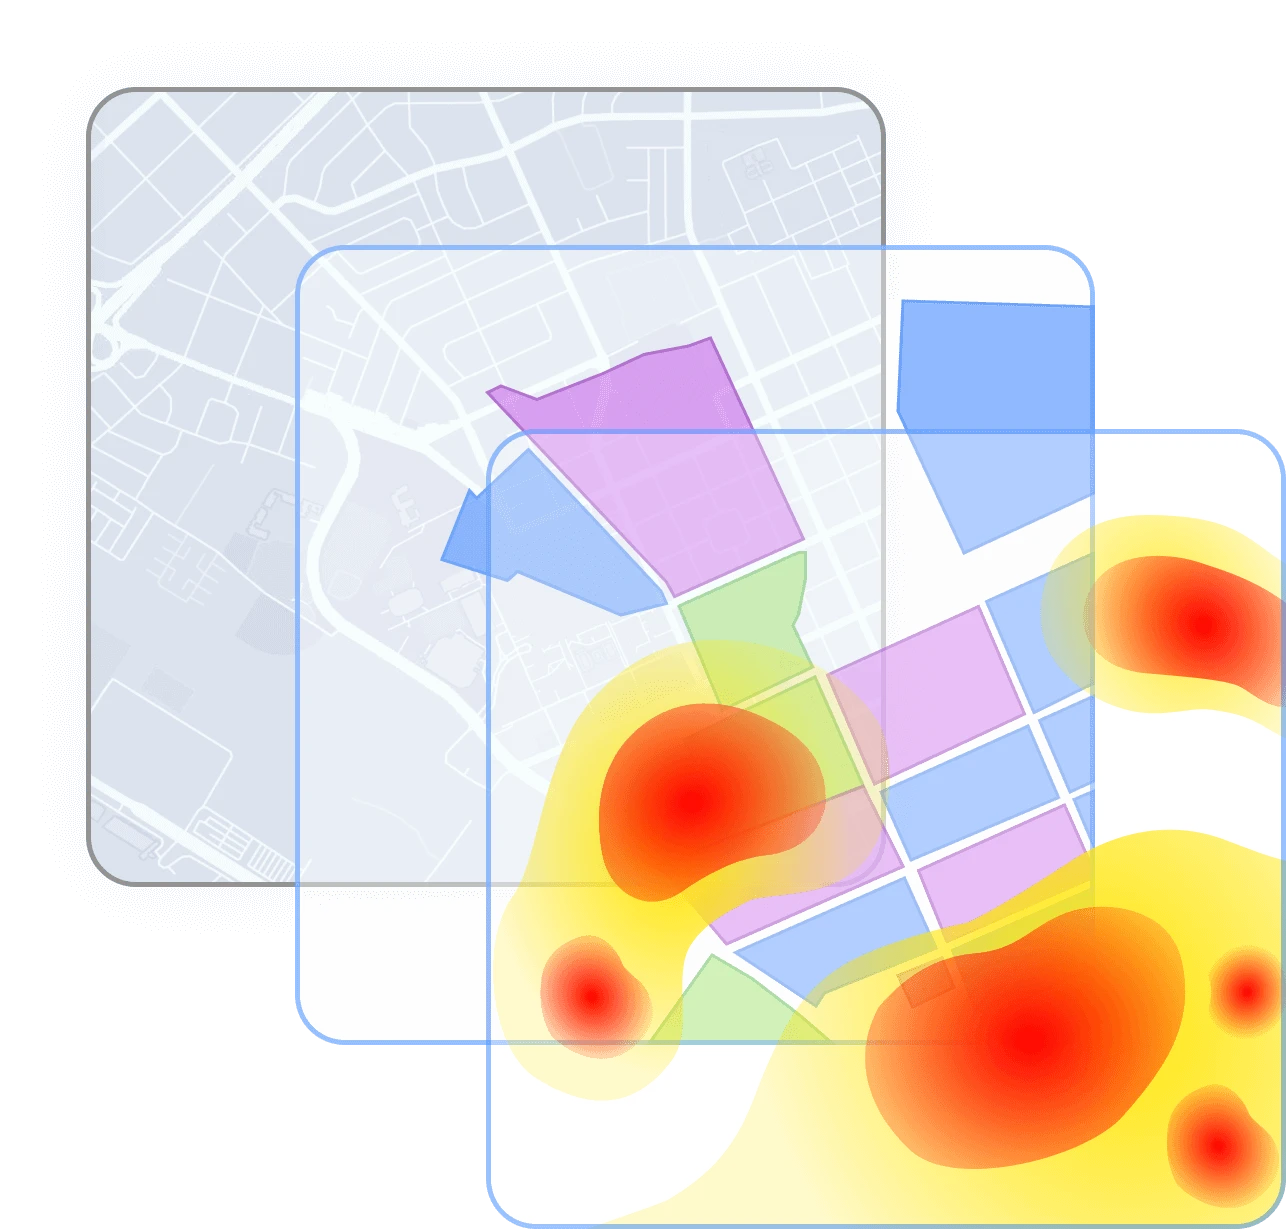
Layering visualizations
User can change visualization complexity by applying or removing data layers
that best
assist them in inferring insights and making decisions.
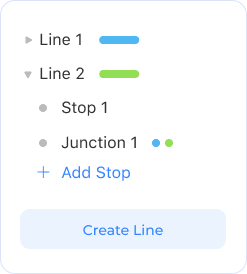
Grouping Lines and Stops
Providing hierarchical grouping of lines and stops enables user to easily
identify and edit
design elements and make design iterations.
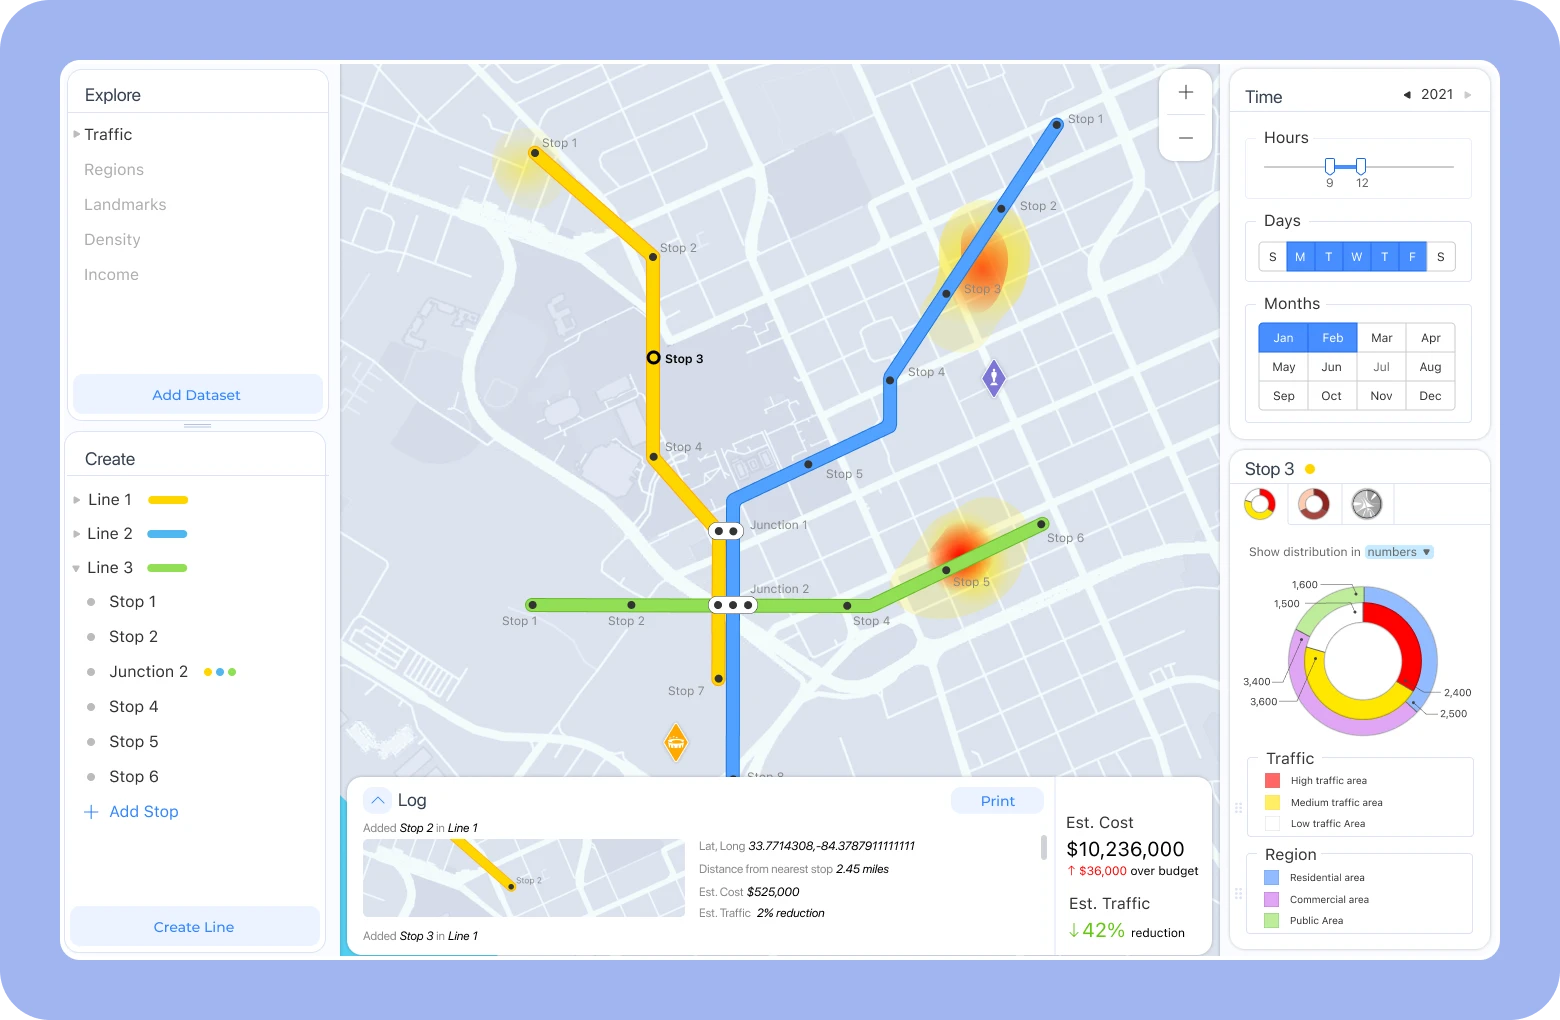
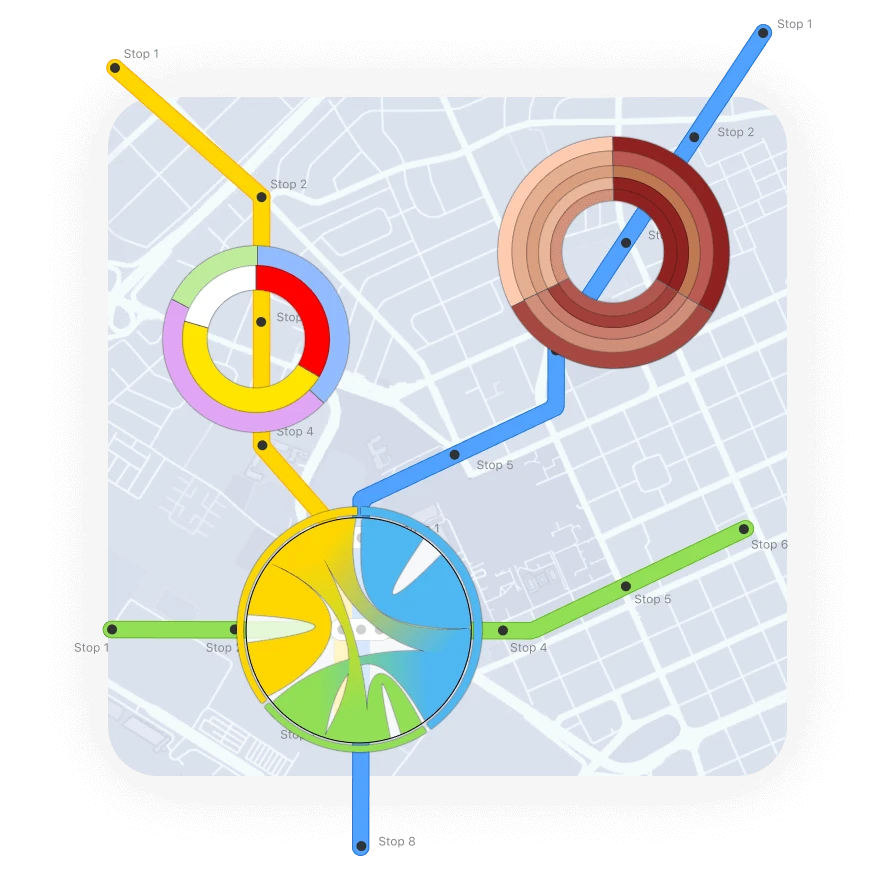
Vis Assistance (Create Mode)
Providing dynamic visualizations such as donut, radial and chord charts allows
user to focus
on region of interest and leaves the guess work out of the design decisions.
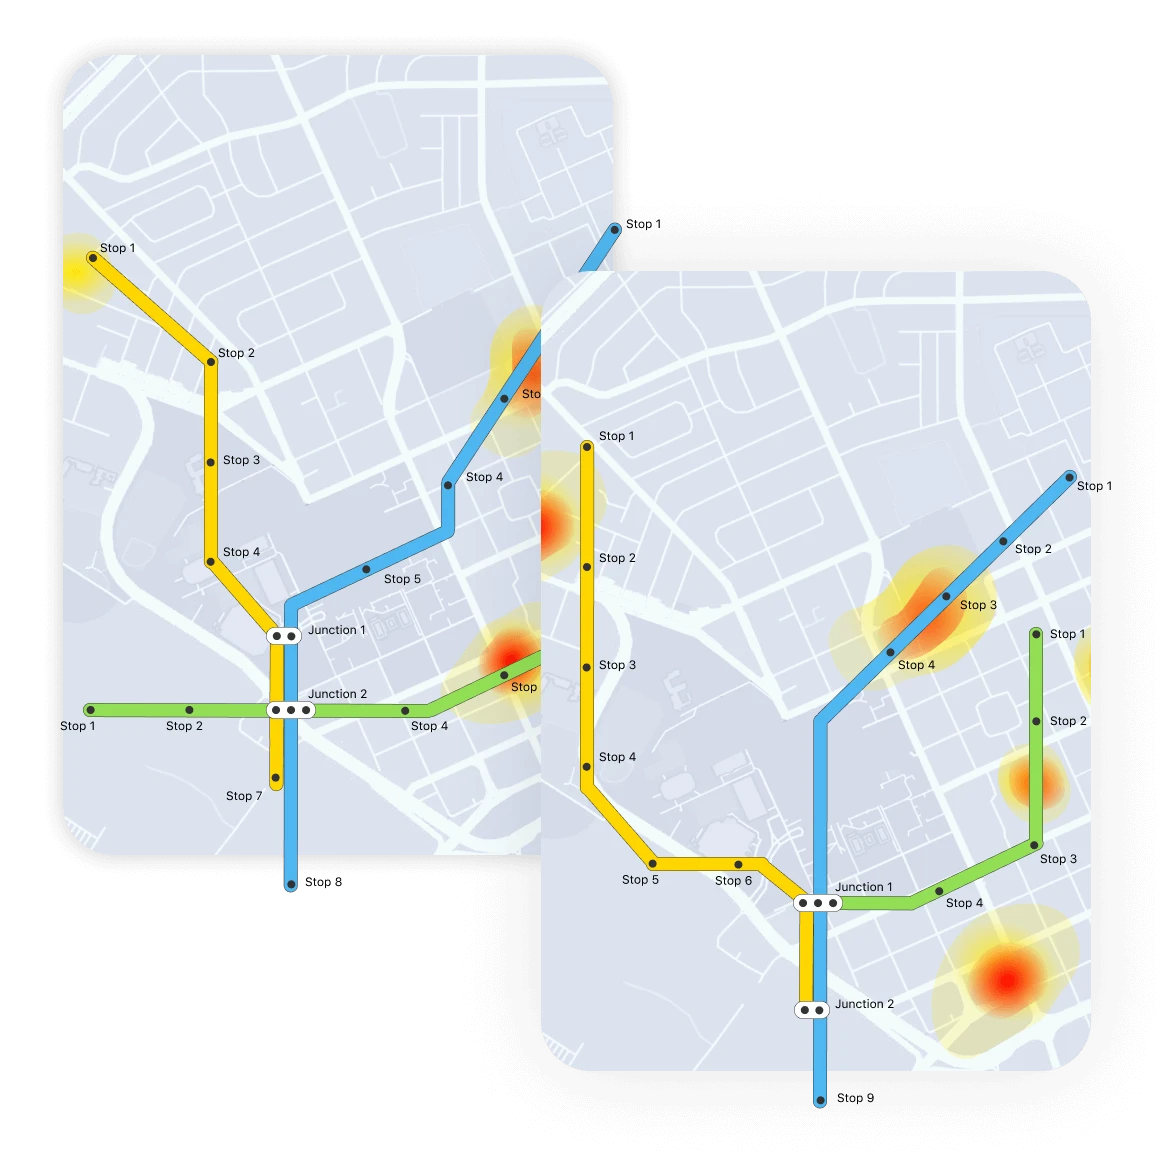
Compare Design Layouts
Compare layouts and analyze impact on high-traffic zones, allowing user to
select
the best layout design.
Takeaway
Overall, I enjoyed taking on this design activity. Coming up with a design solution for a user group
that you do not have direct access to and their profession that you do not know much about was
challenging. However, utilizing other resources to conduct research and looking at other tools for
inspiration, I was able to design solution that meets the user requirement. Designing from a data
visualization perspective allowed me to push past my limits and eventually, also added value to the
project.